Author: Jones Industrial Team

Quarterly Report Q1 2024

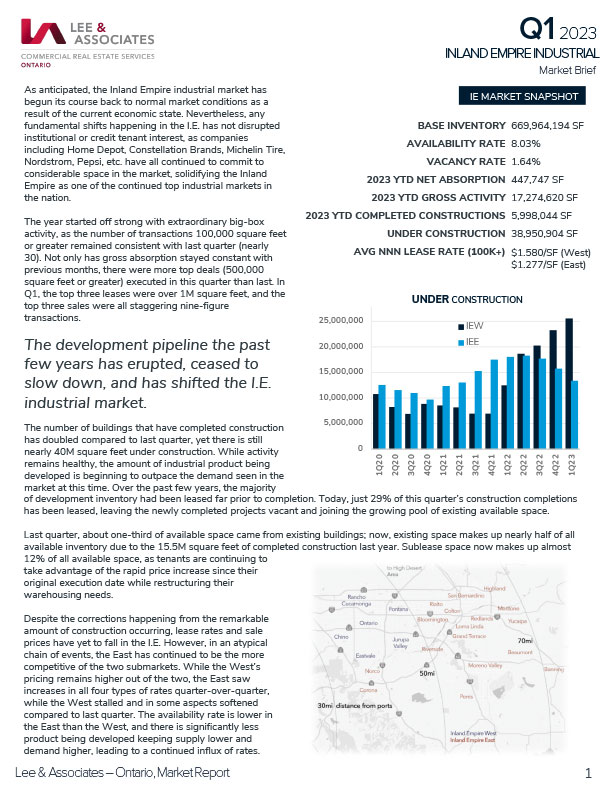
Tenant demand has resumed its prominent role in the Inland Empire industrial market. Total activity in the I.E. nearly doubled compared to both Q3 & Q4 of last year. Four one-million square foot lease transactions were executed in the first quarter of this supposedly tumultuous year. Q1 saw the most big-box (100,000 square feet or greater) leases signed in a single quarter since mid-2022. These substantial deals, in conjunction with the newly-completed & previously-leased industrial product delivered, contributed to the positive net absorption seen in Q1. Vacancy continues to tick up, as the development pipeline trends down (53% year-over-year).

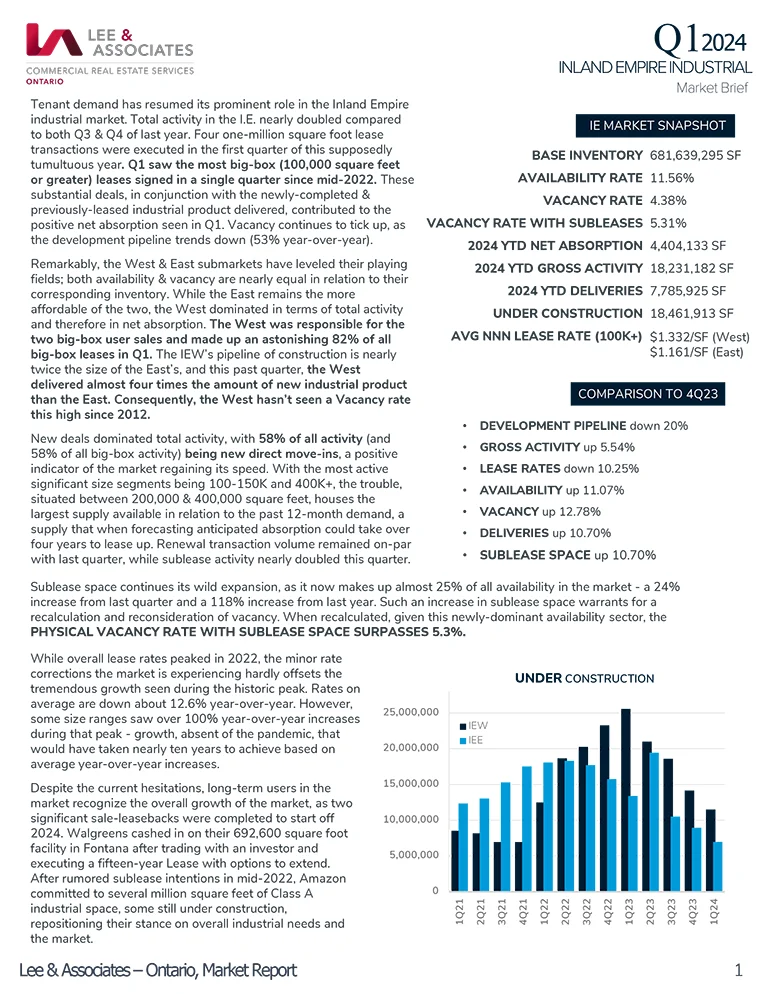
Remarkably, the West & East submarkets have leveled their playing fields; both availability & vacancy are nearly equal in relation to their corresponding inventory. While the East remains the more affordable of the two, the West dominated in terms of total activity and therefore in net absorption. The West was responsible for the two big-box user sales and made up an astonishing 82% of all big-box leases in Q1. The IEW’s pipeline of construction is nearly twice the size of the East’s, and this past quarter, the West delivered almost four times the amount of new industrial product than the East. Consequently, the West hasn’t seen a Vacancy rate this high since 2012.

Quarterly Report Q4 2023

While 2023 posed a strong pause in many sectors, the Inland Empire industrial market remained stable all things considered. Certain fundamentals have reached levels not seen in over a decade due to the extreme spike in development of certain size ranges and cities: development spurred by the previous, extremely-low vacancy coupled with the heightened demand in 2020 and following quarters. Most of that heightened development is now delivering, as almost 29M square feet of industrial product will bear the label “Built in 2023.” In Q4 alone, the Inland Empire delivered the most industrial product in the West submarket in at least fifteen years, if not the most in the history of the sector.

Radical demand was fulfilled with an extreme amount of development, leading to an oversupply, resulting in the sudden and substantial increase in available space. Availability is up year-over-year over 60%, weakening the landlord’s leverage in the market. Sublease space continues to deepen its market share, as subleases currently take up nearly 20% of all available space on the market. The I.E. industrial market hasn’t seen an availability rate this high since 2012, with vacancy being the highest in ten years.

Quarterly Report Q3 2023

Adverse market conditions have ultimately caught up to the Inland Empire Industrial Market. In just one quarter, availability is up 15%, vacancy jumped 24%, and Q3 had nearly half as many big-box (over 100,000 square feet) lease transactions then last quarter. Despite inevitable market corrections, the I.E. industrial sector seeks to sustain the incredible growth experienced the past few years from the increase in e-commerce activity and greater logistics requirements, factors that will most likely linger.

Development in the I.E. is reaching its apex. With an entire quarter to go, developers have already completed more construction in the Inland Empire year-to-date than at the end of both 2021 and 2022. As supply is stacking up, the amount of industrial square footage under construction has begun to slow from the Q1 peak.

Quarterly Report Q2 2023

Economic market conditions have disrupted many sectors of the real estate industry. However, the industrial market continues to hold its ground, specifically in the Inland Empire. Overall, lease activity remains healthy with over thirty big-box (100,000 square feet or greater) deals being executed this past quarter, which is more than Q1. About 65% of those transactions were new deals. Total renewal activity among all size ranges took up just 18% of all lease transactions, while about 13% of all deals were subleases.

Despite the strong volume of deals being done, the amount of completed industrial product over the last year has begun to bump the vacancy rate up.

Quarterly Report Q1 2023

As anticipated, the Inland Empire industrial market has begun its course back to normal market conditions as a result of the current economic state. Nevertheless, any fundamental shifts happening in the I.E. has not disrupted institutional or credit tenant interest, as companies including Home Depot, Constellation Brands, Michelin Tire, Nordstrom, Pepsi, etc. have all continued to commit to considerable space in the market, solidifying the Inland Empire as one of the continued top industrial markets in the nation.

The year started off strong with extraordinary big-box activity, as the number of transactions 100,000 square feet or greater remained consistent with last quarter (nearly 30). Not only has gross absorption stayed constant with previous months, there were more top deals (500,000 square feet or greater) executed in this quarter than last. In Q1, the top three leases were over 1M square feet, and the top three sales were all staggering nine-figure transactions.